The comeback of the hydraulic lift
Once upon a time, in the 1980s, roughly until the end of the last century, hydraulic lifts represented the largest segment of lifts installed in Europe.
The reason was simple: hydraulic lifts are sturdy, simple, silent; their maintenance is easy and cheap, a non-professional can free the passengers in case of breakdown or untimely stop, etc.
They were considered the ideal solution for low buildings, up to 5 stops with relatively low traffic.
But then appeared the environmental debate, which focused nearly entirely on energy in the building sector.
Energy efficiency became the mantra, also for lifts and escalators, even if they only represent a small fraction of the energy consumption of buildings, between 3 and 8 % of the total energy use, depending on the type of building.
Directive 2002/91/EC of 16 December 2002 on “the energy use performance of buildings” does not stipulate anything for lifts,escalators and moving walks; an indication that lifts were considered as a negligible consumption in buildings.
At the same time, the lift industry managed to drastically reduce its energy consumption, roughly by two thirds over 40 years, for both electrical and hydraulic lifts, by adopting innovative and new drive technologies, modifying drives and speed regulation, etc.
It came to a point where traction (electrical) lift manufacturers used energy as a decisive factor to choose a traction rather than a hydraulic solution. The market followed.
In 2017, the European market is 77% traction for a mere 23% hydraulic, the opposite of 40 years before (24% of hydraulic lifts in the residential segment, 22% in the tertiary and 28% in the industrial segments).
Today you find high-end traction lift applications, with 3 stops, in buildings with very low traffic: a total nonsense in terms of costs, maintenance costs, and even energy.
The Hydraulic lift technology has basically remained the same for decades and consumption – though higher per trip – is most often lower, since hydraulic lifts are used less often in residential or smaller administrative buildings (which is the large majority of lifts installed).
In a hydraulic lift, the piston lifts the whole cabin with the whole charge (4 x), when going up.
When coming down, the consumption of energy is equal to zero (0 x). The result of the functioning of a hydraulic lift is twice the charge on average.
The power installed for a hydraulic lift is of 1 to 4, but usually the yearly consumption is limited to 1.5 times, since the car often goes up without charge (called from the floors) and counts for zero energy use, while coming down.
The major manufacturers of lifts gradually abandoned the hydraulic technology before the turn of the century and their marketing efforts presented hydraulic lifts as “a solution of the past, much too energy-consuming”.
Hydraulic lifts were only considered for very large and slow lift applications (lifts for cars in parkings for example),
and the market dwindled. Hydraulic lifts are now produced only by SMEs in Europe.
The sort of “energy hysteria” that developed never mentioned the fact that the energy “supplement” consumed by a hydraulic lift over one year, was a few kWh and the value about €100 for the lift owner. Peanuts!
Compared to the saving in maintenance and other advantages, the hydraulic lift was still a good option, even in terms of energy consumption.
But the damage was done and the choice of the largest companies was a steamroller
for traction solutions.
It went even further! The respected AMEV in Germany (Ministry of Construction),
in its instructions to the civil servants that needed to write a call for tender for a new lift
in a public building received as instruction
“not to choose a hydraulic lift, except if they could specifically justify it”.
ELCA and VDMA in Germany had to pinpoint the issue of unfair competition, to obtain
that the German AMEV take out the 5 or 6 negative sentences for hydraulic lifts, at different places
in the instructions.
Energy efficiency of a full Life Cycle Analysis?
The Energy performance of buildings is a key issue and architects dream of being able to propose “energy-positive” buildings: buildings that produce more energy than they consume. In order to reach that very difficult goal, the architect and builder must get every little kWh he can save: solar
or wind energy productions, excellent insulation to make the building totally “passive”, etc.
In large and medium-size buildings, lifts contribute through software programmes that manage traffic, change of lighting (LED) and mainly energy recovery.
When the lift functions empty and the couple is negative (heavier counterweight), the system
is enabled to give energy back to the electricity grid,
which improves the energy efficiency of the system. Good points.

But over the last few years, an all-encompassing vision has made a breakthrough: the Life Cycle Analysis (LCA).
In an LCA, energy is only one of the areas which are envisioned to really assess the environmental impact of the lift, its
“ecological footprint”.
The experts will look at everything and produce a real photography of the lift impact:
- Materials extraction & processing
- Manufacturing (components manufacturing & assembly)
- Transport and distribution
- Installation
- Use (where energy efficiency is taken into account)
- Maintenance
- Dismantling and recycling (end-of-life)
ELCA (European Lift & Lift Component Association) wanted to have the final truth about the compared environmental impact of hydraulic and traction lifts over their whole lifetime.
So the association ordered a comparative LCA study from the respected ITA (Instituto Tecnologico de Aragon) laboratory, at the University of Saragossa (Spain). ITA is one of the top Technology centres in Europe. Its laboratories provide technological research, development and innovation to re-invent products, services or processes. ITA monitors many new technologies such as robotics and automation: among them lifts & lifting devices.

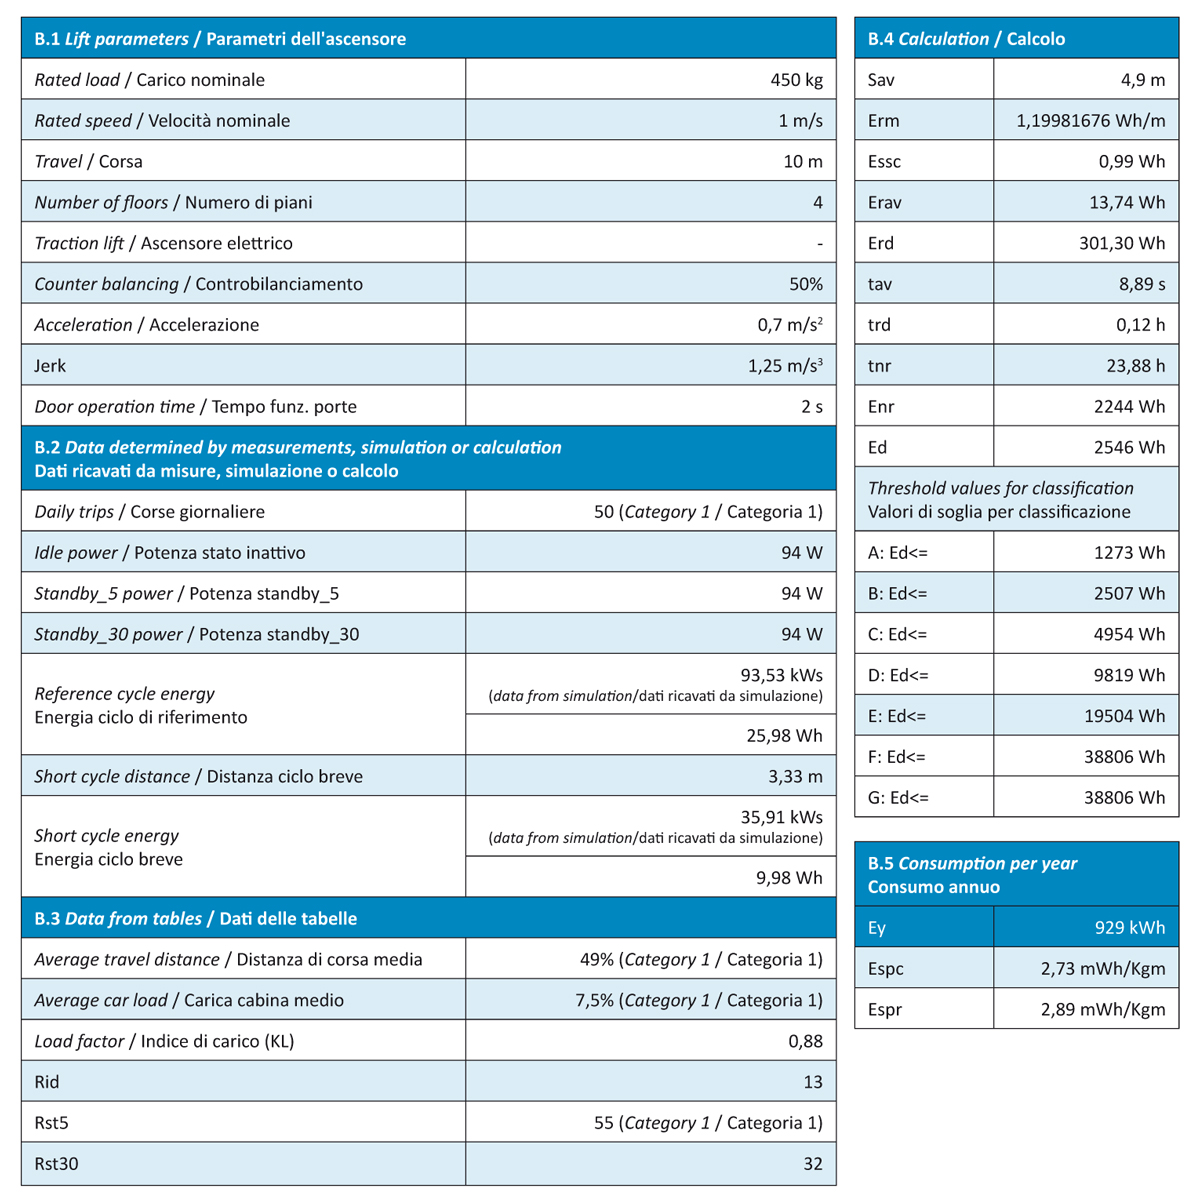
Life Cycle Inventory: use phase for reference traction lift.
Category Use 1

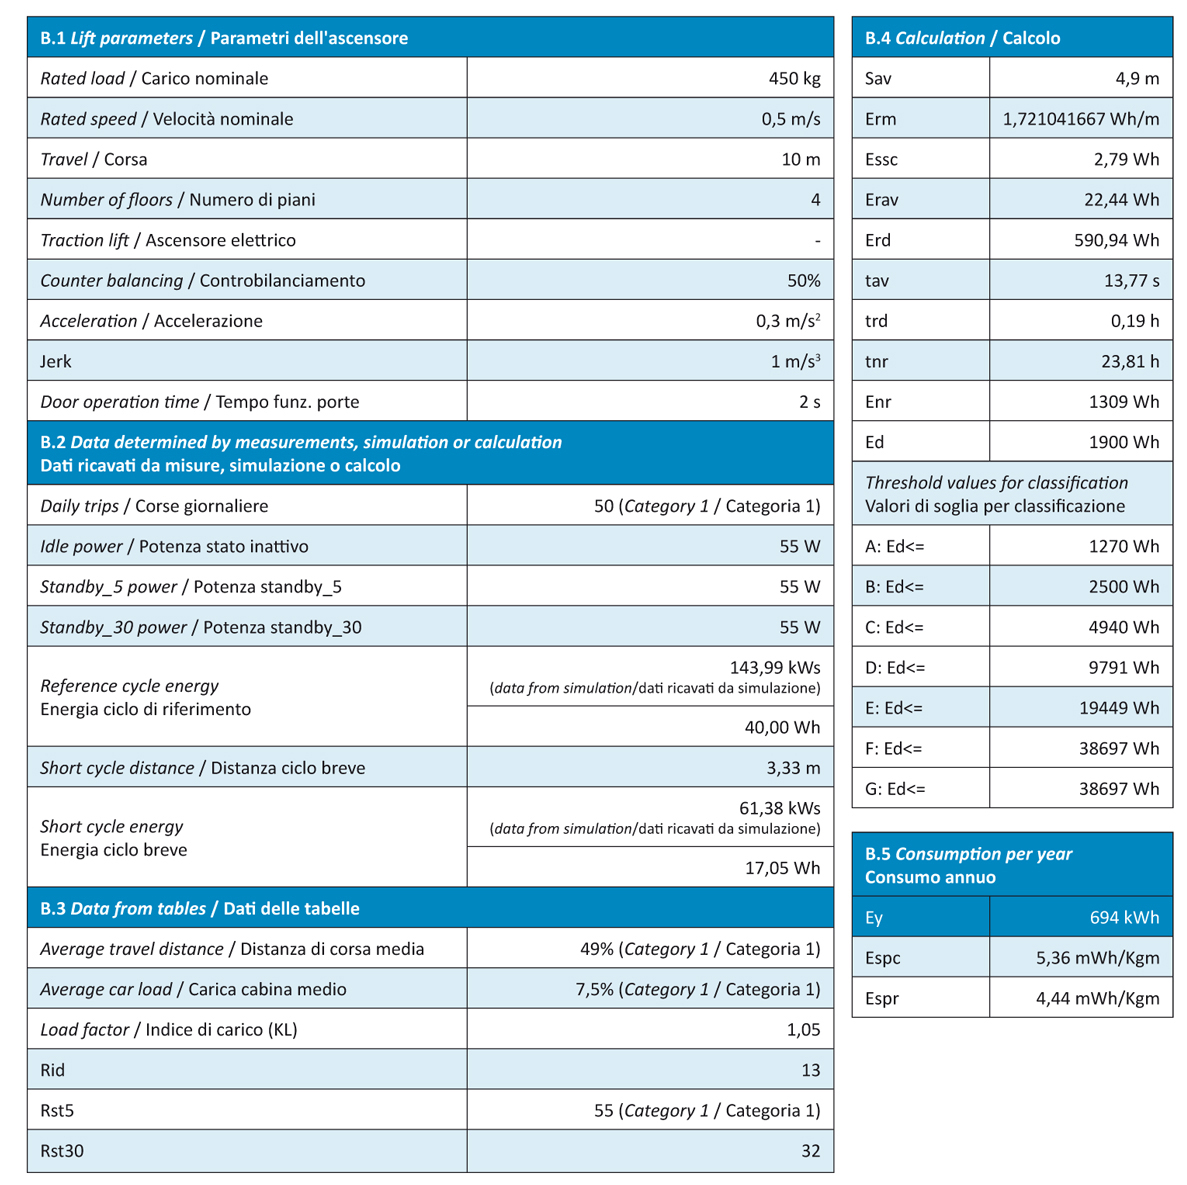
Life Cycle Inventory: use phase for reference traction lift.
Category Use 2
In 2015, ELCA ordered a “comparative study of life cycles of hydraulic & traction lifts in different categories”. ELCA co-financed the operation with member and non-member companies of the sector in Italy, Spain, Germany and Sweden. ITA was in charge of collecting full data for specific lifts, both traction and hydraulic throughout Europe, testing some lifts in Saragossa to complement their data collection, and then compare apples with apples and pears with pears.
The result is astounding, and could very well mean a “return of the hydraulic lift” in the years to come, throughout Europe. It is not normal that hydraulic lifts only represent a mere 24% of the residential segment of the market.
What does the final report say?
- Clearly, the Traction lifts have an advantage in energy consumption during the Usage phase. This is actually limited to the movements of the lift car. The largest part of electricity consumption of a lift is during the standby phase, when it waits for passengers, and there, all lifts are equal… They need to have “sleep modes” that “wake them up” when a passenger presses the button. New controllers are much more sophisticated now to reduce standby consumption of both hydraulic & traction lifts.
- Hydraulic lifts have less impact in the initial phases (materials, transport), always resulting in a product with a better (lower) environmental profile in a “cradle to grave” approach, without including the service period.
- Hydraulic lifts have also a better profile for all categories where the use is not very intense, resulting in a better global option for Usage categories 1 & 2. That means for up to 150 daily trips.
- Traction lifts have a higher impact in the initial phases and a worse profile in the service phases (energy consumption) for Usage categories 1 & 2. For more intense usages, categories 3 and higher, the lower energy consumption during service, tends to compensate for the initial higher impact, resulting in a better (lower) general environmental profile for installations starting at 300 daily trips and more. Nevertheless, even for this category 3, hydraulic lift could even be a better option for special cases with a lifespan which is shorter than 10 years.
Having carefully looked at all the results and without any bias for or against any of the two technologies, ELCA believes that energy efficiency, heavily promoted in the last decades as the “supreme” element for measuring the environmental footprint of lifts, gives a wrong perception of reality. For whatever machine of piece of equipment actually, the best option is the LCA.
It is a long and complicated task to collect all relevant data, but the results don’t lie.
ELCA thanks ITA for this study that does justice to the hydraulic lift.
Luc Rivet
Secretary General ELCA – European Lift Component Association
THE COMEBACK OF THE HYDRAULIC LIFT
A short interview with Alfredo Gomez ITA – Instituto Tecnologico de Aragon
How did you get to work on this contract?
Well, we already had produced life cycle assessments for several traction and hydraulic lifts in the last few years, mostly for Spanish companies. We used this background and experience as the basis for this work and through ELCA we also received extensive, complete data from companies in Sweden, Germany, Italy and Spain for both traction and hydraulic lifts. The Swedish firm Hydroware for example, had made two official LCAs on a hydraulic lift and a traction lift in Germany, so the data were also used.
Is it complicated a study?
Very (smile). Some data can completely change the assessment for a specific lift. Carlos Peribanez who led the study at ITA, took a period of 20 years for our calculations, but changing the lifetime changes the results you obtain. You must also understand that the environmental impact of energy consumption is different on the environment (climatic change), depending on the electricity generation. If the country where the lift is installed burns coal to produce electricity, it has bad CO2 results). If its electricity mix is better (nuclear, hydraulic or renewable sources), the climate change results will be better. So in our result tables, we have used UCTE, which is an average European value.
How did you classify your results and what software did you use?
We have made our analysis to come up with average results for a traction lift in each category (1,2 and 3), and have done the same to obtain an average hydraulic lift in each category. We have also made a life cycle assessment for a hydraulic modernization. It indicates that a hydraulic modernisation has a lower (better) impact than a replacement by a traction lift.
For those interested in the techniques used; the calculation method are CML-IA baseline EU25 and ReCIPe, as it was recommended by the work developed in the PCR (Product Category Rule) for Lift, under the programme developed by Environdec regarding EPD (Environmental Product Declaration).
For climate change, the impact was calculated in kg CO2 and for ReCIPe, in points.
The LCA software is SimaPro 8.0.3.


